 Wireless sensor node is a sensor node with a wireless transmitter. It has one or more sensing elements with amplifier and signal conditioning circuit or a digital/smart sensor, a microcontroller unit, modulator and transmitter with antenna, and a battery. Powered by a battery or solar power it senses temperature, sunlight, soil moisture, or tremor, etc and transmits the signal to a remote receiver.
Many such sensor nodes are placed at regular distances in a big geographical area to cover the whole area. All of them send their data to a receiver that is placed in a central data monitoring and storage system. All the sensor nodes transmit data (value) periodically. The receiver receives the data from all such nodes and stores and displays it for monitoring and controlling purpose.
Let us have a look at some examples.
In an agriculture field, the automatic irrigation system has many soil moisture sensor nodes that are spread over the entire farm. These periodically transmit soil moisture level to one central receiver, which is connected to monitoring and control system. If soil moisture level in one particular area goes below the threshold level, the water pump, solenoid valve, etc in that area is automatically turned on. Thus, required soil moisture level of the complete farm is maintained.
At the border between two nations, sensor nodes with PIR proximity sensors may be placed at regular distance to detect any motion at the border and send warning/alarm message to the controlling station.
For a green house, proper temperature, humidity, and sunlight needs to be maintained. So, it is equipped with many sensor nodes that sense temperature, humidity, and sunlight at different places in the green house and sends the data to central control room periodically. The central control room increases/decreases cooling, humidity, or light intensity as per the collected sensor data.
In this project, the multiple sensors used are digital humidity and temperature sensor, light-dependent resistor (LDR) that senses ambient light, and soil moisture sensor that senses soil moisture content. The project also makes use of Arduino Nano as microcontroller (MCU) and 433MHz ASK RF transmitter module. There can be many such sensor nodes but only two such nodes are used here.
The receiver includes 433MHz ASK RF receiver module, real-time clock (RTC) module, and Arduino Nano. Both sensor nodes transmit data of sensed values of temperature, humidity, ambient light, and soil moisture content. The receiver receives the values from both sensors (total eight values) and gives them to computer, which displays these values and stores for future use.
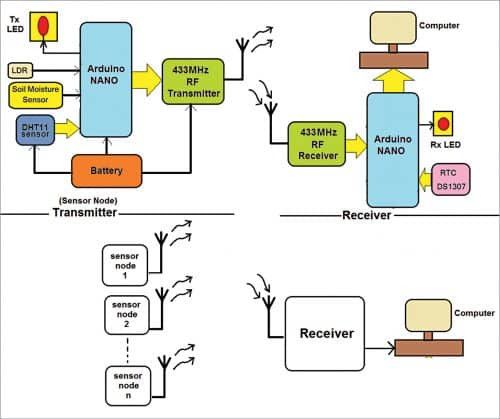
As shown in block diagram of the project in Fig. 1, there are two distinct parts—transmitter (sensor node) and remote data receiver. The sensor node consists of different sensors, microcontroller, RF transmitter, and battery.
Sensors
DHT11 is a smart sensor that senses surrounding temperature and humidity and sends this data to microcontroller. LDR senses ambient light, and soil moisture sensor senses soil moisture content.
Microcontroller
Arduino Nano board is used as a microcontroller to read the data from all three sensors and transmit it using RF transmitter.
RF transmitter
An ASK based RF transmitter module with 433MHz carrier frequency is used to modulate and transmit the sensor data to the receiver.
Battery
A 6V or 9V battery is used to provide power supply to a complete sensor node.
An LED blinks to indicate that sensor node is active, and it is transmitting data.
Remote data receiver has only RF receiver module and microcontroller.
RF receiver
An ASK based RF receiver module with 433MHz carrier frequency is used to demodulate and receive data transmitted by sensor node’s RF transmitter module.
Microcontroller. Arduino Nano board is used as microcontroller that gets the data from RF receiver module and gives it to computer, which stores it for future use.
LED in receiver blinks to indicate the receiver is active and it is receiving data.
Sensor node (transmitter)
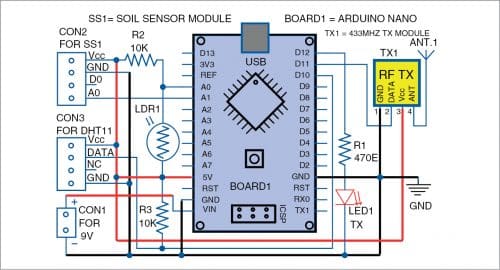
As shown in circuit diagram of a sensor node in Fig. 2, there are only five major components in the transmitter circuit:
1. Sensor DHT11 that has three interfacing pins: Vcc, Gnd, and Data Out. Vcc pin is given 5V supply from Arduino board and Gnd pin is connected to common ground. Data Out pin is connected to digital pin D10 of Arduino Nano board. It is pulled high by pull-up resistor R3, as shown in Fig. 2.
2. Soil moisture sensor SS1 that has three pins for interfacing: Vcc, Gnd, and A0. Vcc pin is given 5V supply from Arduino Nano board and Gnd pin is connected to common ground. SIG/A0 pin is analogue output of sensor that is connected to analogue input pin A1 of Arduino Nano board.
3. LDR1, which is connected in pulled down configuration with a 10-kilo-ohm resistor (R2). Its output is connected to analogue input pin A0 of Arduino Nano board.
4. 433MHz RF transmitter module (TX1) that has four interfacing pins: Vcc, Gnd, Data, and Antenna. Vcc pin is connected to 5V output of Arduino board and Gnd is connected to common ground. Data pin is connected to digital pin D11 of Arduino board. An antenna (ANT.1) is formed by winding a 1mm diameter, 35cm long copper wire (single core) that is connected to antenna pin.
5. LED (LED1), which is connected to digital pin D12 through current limiting resistor R1.
A 9V battery or regulated power supply is used to power Arduino board. Arduino board Vin pin is connected to battery, so the board generates 5V supply from onboard 7805 voltage regulator chip, which is given to DHT11 and 433MHz RF transmitter module (TX1).
The sensor node periodically senses temperature, humidity, soil moisture, and ambient light and transmits the values. But, as shown in the block diagram, there may be any number of sensor nodes. They would all be transmitting their values. It may happen that more than one node transmit data at the same time. Also, how the receiver would know the data received is from which node?
To overcome these problems all sensor nodes are synchronised in time such that two nodes do not transmit simultaneously. But if that happens, the receiver will accept any one sensor data. Also, all the nodes are assigned numbers (say, from 1 to N). Before they transmit their data, they transmit their node number. So, the receiver knows the exact sensor node from which the data is coming.
The DHT11 sensor gives accurate and calibrated measurements of temperature and humidity. It gives direct digital values for both measurements. Arduino microcontroller reads these values and converts them into character form (ASCII).
As ambient light falling on LDR1 increases, its resistances decreases and analogue voltage output increases. So, the analogue output voltage from LDR1 is directly proportional to ambient light. Arduino converts this analogue voltage into digital value (between 0 and 1023) and maps it between 0 and 99%. Finally, it converts this percentage value into ASCII characters.
Soil moisture sensor (SS1) produces analogue voltage output inversely proportional to soil moisture content. That means its output voltage decreases as soil moisture content increases. Arduino converts this analogue voltage into digital value (between 0 and 1023) and maps it between 0 and 99%. Finally, it converts this percentage value into ASCII characters.
And then these data are sent to RF transmitter module (TX1) through pin D11 of the Arduino.
TX1 gets this string of ten characters (we may call it as packet), modulates it using 433MHz carrier and transmits it through antenna ANT1. Every time the packet is transmitted, the microcontroller blinks the LED1 to indicate data is being transmitted. This cycle repeats continuously after every set time period (say, 10 seconds).
Remote data receiver
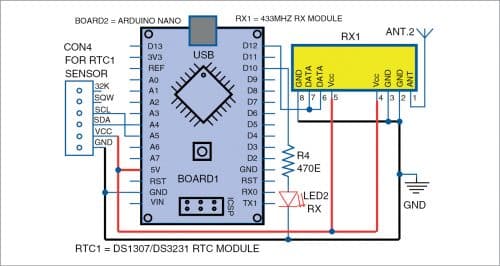
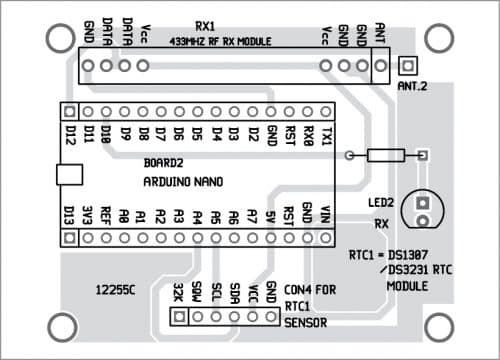
As shown in the circuit diagram of remote data receiver in Fig. 3, there are only three major components in this receiver circuit:
1. 433 MHz RF receiver module RX1 that has four interfacing pins: Vcc, Gnd, Data Out, and Antenna. Vcc pin is connected to 5V output of Arduino board and Gnd is connected to common ground. Data pins are connected to digital pin D12 of Arduino board. An antenna (ANT.2), same as transmitter side, is connected to antenna pin.
2. RTC module used here is a DS1307 RTC chip having four interfacing pins: Vcc, Gnd, SDA, and SCL. Vcc pin is connected to 5V output of Arduino board and Gnd is connected to common ground. SDA and SCL pins are for TWI (IIC) byte oriented data transfer. These are connected to A4 (SDA) and A5 (SCL) pins of Arduino Nano board, respectively.
3. LED (LED2), which is connected to digital pin D10 of Arduino through current-limiting resistor R4.
The Arduino Nano board and RF RX1 module get power supply from central storage system computer through USB cable. The Arduino Nano board also logs data and communicates with computer using the same USB cable.
Working and operation of the remote data receiver can be understood from the following steps:
- The receiver first checks whether RTC is running and giving correct date and time or not. If RTC is running, Arduino displays current time on the serial monitor.
- The RF RX1 module receives packets from every node. It demodulates and gives these packets to Arduino microcontroller.
- The microcontroller gets the packets and extracts all four values from each packet: ambient light, soil moisture content, temperature, and humidity along with node number.
- It serially sends following data to computer through USB as Node x:
- Soil moisture: XX %
- Light: XX %
- Humidity: XX %
- Temperature: XX °C
- The microcontroller blinks LED2 to indicate data is being received.
- Also, each time Arduino gets data from any sensor node, it reads time and date from RTC module and serially sends it to computer. So, the sensor node data values are printed along with time and date.
- All four sensor data values with time and date are displayed on serial monitor in sequence.
- This process repeats for each packet received from any node at any time. As all nodes are synchronised in time, they transmit data sequentially one after another.
- The receiver gets data from all nodes one by one and it updates readings of any node after set time period.
When RTC is turned on for the first time, its current date and time have to be set using rtc.adjust ( ) function (given in the program with comment). Once date and time are set for RTC, we have to again comment out the rtc.adjust ( ) function from program and upload the program again. So, the receiver program is to be uploaded two times in Arduino Nano board.
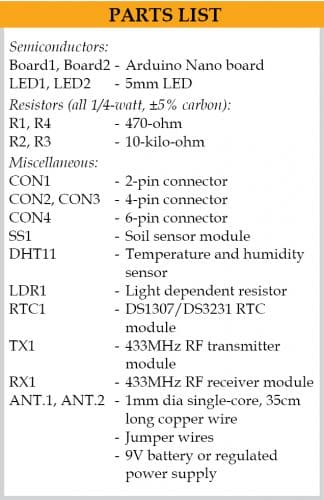
There are two source codes: Labtesttxnode.ino code for sensor node and LabtestRx.ino code for receiver. The Labtesttxnode.ino code in Board1 is used to collect data from the sensors and process the data. The LabtestRx.ino code in Board2 is used to display the time, date, and status of nodes transmission on serial monitor. You need to include the related libraries DHT.zip, RTClib.zip, and VirtualWire.zip before uploading the source codes.
Construction and testing
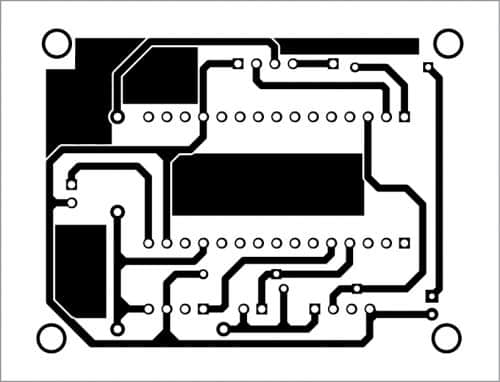
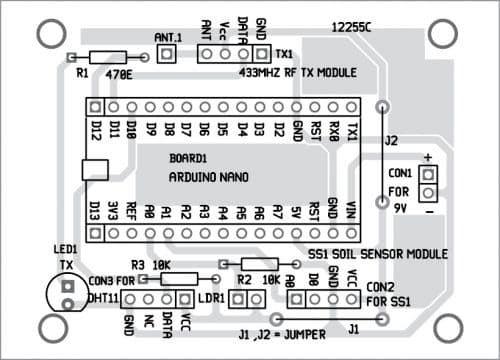
An actual-size PCB layout for the transmitter (sensor node) is shown in Fig. 4 and its components layout in Fig. 5. After assembling the circuit on PCB, connect 9V DC to CON1.
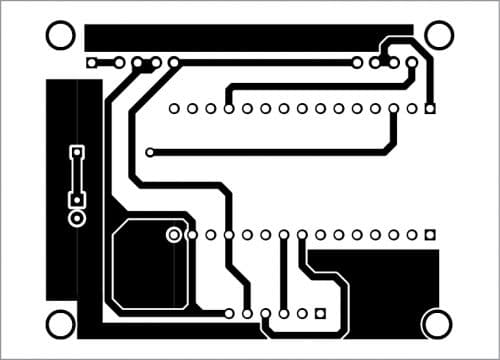
A PCB layout for the receiver is shown in Fig. 6 and its components layout in Fig. 7. After assembling the circuit on PCB, connect the board to a laptop or desktop computer to monitor the data sent from various nodes on serial monitor in Arduino IDE.
Download PCB and Component Layout PDFs: click here
Download Source Code: click here
Ashutosh M. Bhatt is M.Tech in embedded systems. Currently, he is lecturer of electronics and radio engineering at Government Polytechnic, Jamnagar, Gujarat


